
Most engineers pick stepper motors by glancing at one number on a datasheet: holding torque. It's printed in bold, easy to compare across manufacturers, and gives a false sense of confidence. The reality is that holding torque reveals almost nothing about how a motor performs when it's actually spinning. I've watched a 3 N·m motor stall at 400 RPM under load while a 2.5 N·m unit from a different supplier ran smoothly at 800 RPM. Same test setup, same driver, same load. The difference lived entirely in the shape of their torque curves.
This disconnect causes real problems. Machines ship to customers, then motors stall mid-cycle. Designers oversize motors by 40%, adding unnecessary cost and rotor inertia. Production lines stop while someone tries to figure out why calculations that looked fine on paper failed on the floor. Nine times out of ten, the root cause traces back to a torque curve that someone either didn't read or didn't understand.
This article walks through what stepper motor torque curves actually mean for machine design. We'll cover the three torque specs that matter, why torque collapses at speed, how resonance can knock a motor out of sync even when you're within rated limits, and why driver voltage is the lever most engineers underuse. The goal isn't theory. It's making sure your next design works the first time.
What a Torque Curve Actually Shows
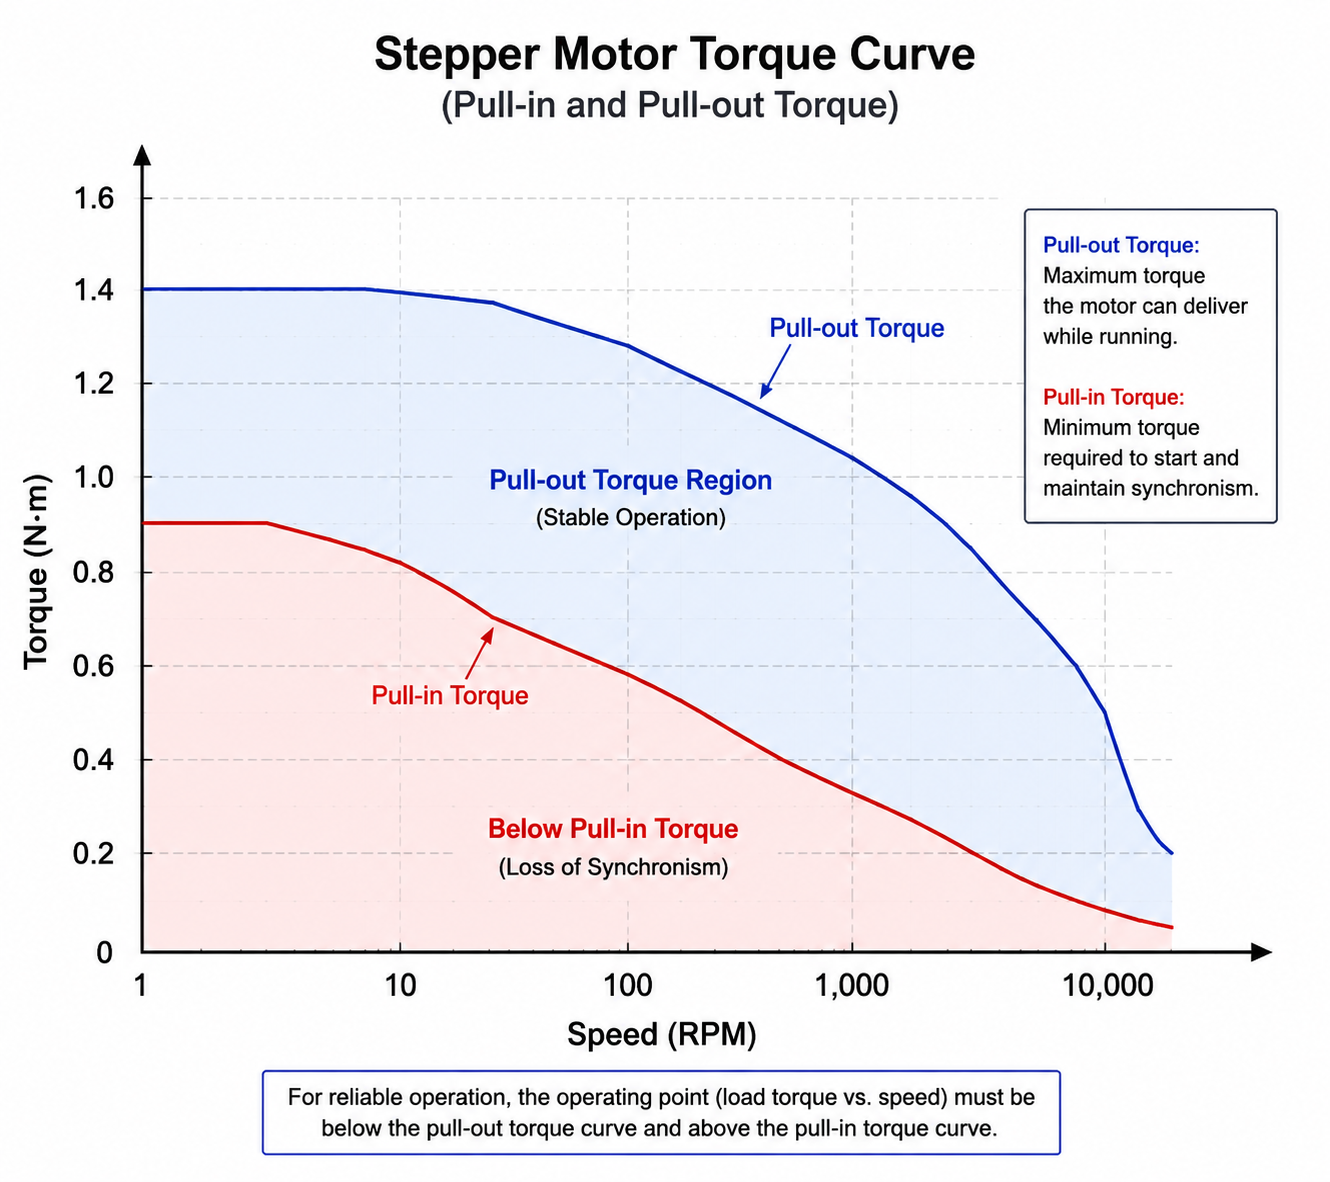
A stepper motor torque curve — sometimes labeled a speed-torque curve or pull-out curve on datasheets — plots how much load the motor can handle at a given speed before it loses synchronization. Speed runs along the horizontal axis, usually in RPM or steps per second. Torque sits on the vertical axis, typically in N·m or oz-in. You get two distinct curves on the same graph: one for pull-in conditions, one for pull-out.
These curves aren't theoretical predictions. They're measured by running the motor against a brake or dynamometer at different speeds and recording the point where it stalls. The test voltage, driver type, and current setting all influence the result. Change any of those variables and you get a different curve. If you're evaluating motors based on a 24V curve but running your application at 48V, the datasheet is underselling what you'll actually get. Reverse the situation and you'll wonder why a motor that "should" work keeps faulting out.
What the torque curve gives you is a boundary. Stay inside it with some margin, and the motor tracks commanded steps. Cross above it, and the rotor loses sync. The controller keeps sending pulses, but the shaft isn't where the controller thinks it is. In open-loop systems, that's a silent failure. No alarm, no fault code — just a positioning error that accumulates until someone notices bad parts coming off the line.
Holding Torque: The Number Everyone Overrates
Holding torque is the static torque a motor can resist when both phases are energized at rated current and the rotor is locked. Think of it as the torque required to forcibly twist the shaft out of position while the motor is powered and stationary. It's measured at zero speed, and it's the biggest number on the spec sheet because it's the easiest to measure and the most flattering to print.
Where holding torque matters: vertical axes that need to hold position with power on, clamping applications, and applications where the load sits stationary for extended periods. It also gives a rough sense of low-speed stiffness. If you need the shaft to resist external forces without deflecting much, holding torque is a meaningful number.
Where it falls apart is anywhere the motor has to move. The relationship between holding torque and torque at 500 RPM is not a fixed ratio. It depends on winding inductance, supply voltage, and back EMF. Two motors with identical holding torque can have completely different torque available at 300 RPM. I've pulled motors rated at 2.8 N·m holding that delivered only 0.9 N·m at 300 RPM, while a different motor with 2.2 N·m holding gave 1.4 N·m at the same speed. The lower-inductance windings on the second motor allowed current to build faster at speed, even though its static rating was lower. If you'd compared only the bold number on page one of each datasheet, you'd have picked the wrong motor.
Pull-In Torque: Starting Without a Running Start
Pull-in torque describes the maximum load the motor can overcome when starting from a dead stop and accelerating to a given speed — without any acceleration ramp to help it. You command a step rate, and the motor either locks in and follows or it doesn't. The pull-in curve defines that boundary.
Why is it lower than pull-out torque? Because the rotor has no momentum at startup. It has to break static friction, overcome load inertia, and accelerate all at once. There's no kinetic energy stored in the rotating mass to assist the magnetic field. The pull-in curve slopes downward with speed because the time available to energize each winding shrinks as step rate increases, so current never reaches full value before the next commutation.
In practice, almost no real industrial application runs without some form of acceleration ramping, so engineers rarely operate strictly inside the pull-in region. But the pull-in curve still matters for machines that execute very short moves with aggressive acceleration. If your move profile is essentially a near-instantaneous start, you're living in pull-in territory whether you planned to or not. The stepper motors complete technical guide includes more detail on winding design and rotor inertia choices that affect this behavior.
Pull-Out Torque: The Curve That Actually Limits Your Machine
Pull-out torque is the maximum load the motor can sustain at speed once it's already synchronized and running. This is the curve you'll spend most of your time looking at because it represents the torque available during the constant-speed and deceleration phases of a move — which is where most machines spend the bulk of their cycle time.
The pull-out curve sits above the pull-in curve because a spinning rotor has momentum. The magnetic field doesn't have to yank it from zero each time. The rotor is already moving, so the field mostly has to maintain lock rather than establish it from nothing. The gap between pull-in and pull-out narrows as speed increases, and at very high step rates the two curves nearly converge.
Cross above the pull-out limit and the rotor loses synchronization. Torque doesn't degrade gracefully — it collapses. The motor stalls, and in an open-loop system there's no feedback to flag the fault. The controller thinks it's executing moves correctly. The machine keeps running. The only way you know something went wrong is when you measure the parts. For closed-loop stepper systems with encoders, the driver catches the fault and can flag an alarm or attempt correction. But the pull-out limit itself doesn't move; the physics of magnetic locking at speed is the same regardless of whether you're monitoring it.
The Physics Behind Torque Drop at Speed
Every stepper motor winding is an inductor, and inductors resist changes in current. When the driver applies voltage, current ramps up according to the winding's L/R time constant, not instantly. At low step rates, the commutation period is long enough that current reaches its rated value well before the next phase switch. Torque is proportional to current, so you get full torque.
As speed increases, the time between commutations shrinks. Eventually it becomes shorter than the time needed for current to rise to the setpoint. The winding never reaches full current, flux is reduced, and torque drops. This is an electrical limitation, not a mechanical one. The bearings aren't the problem. The rotor inertia isn't the problem (yet). The bottleneck is how fast you can push current through an inductor.
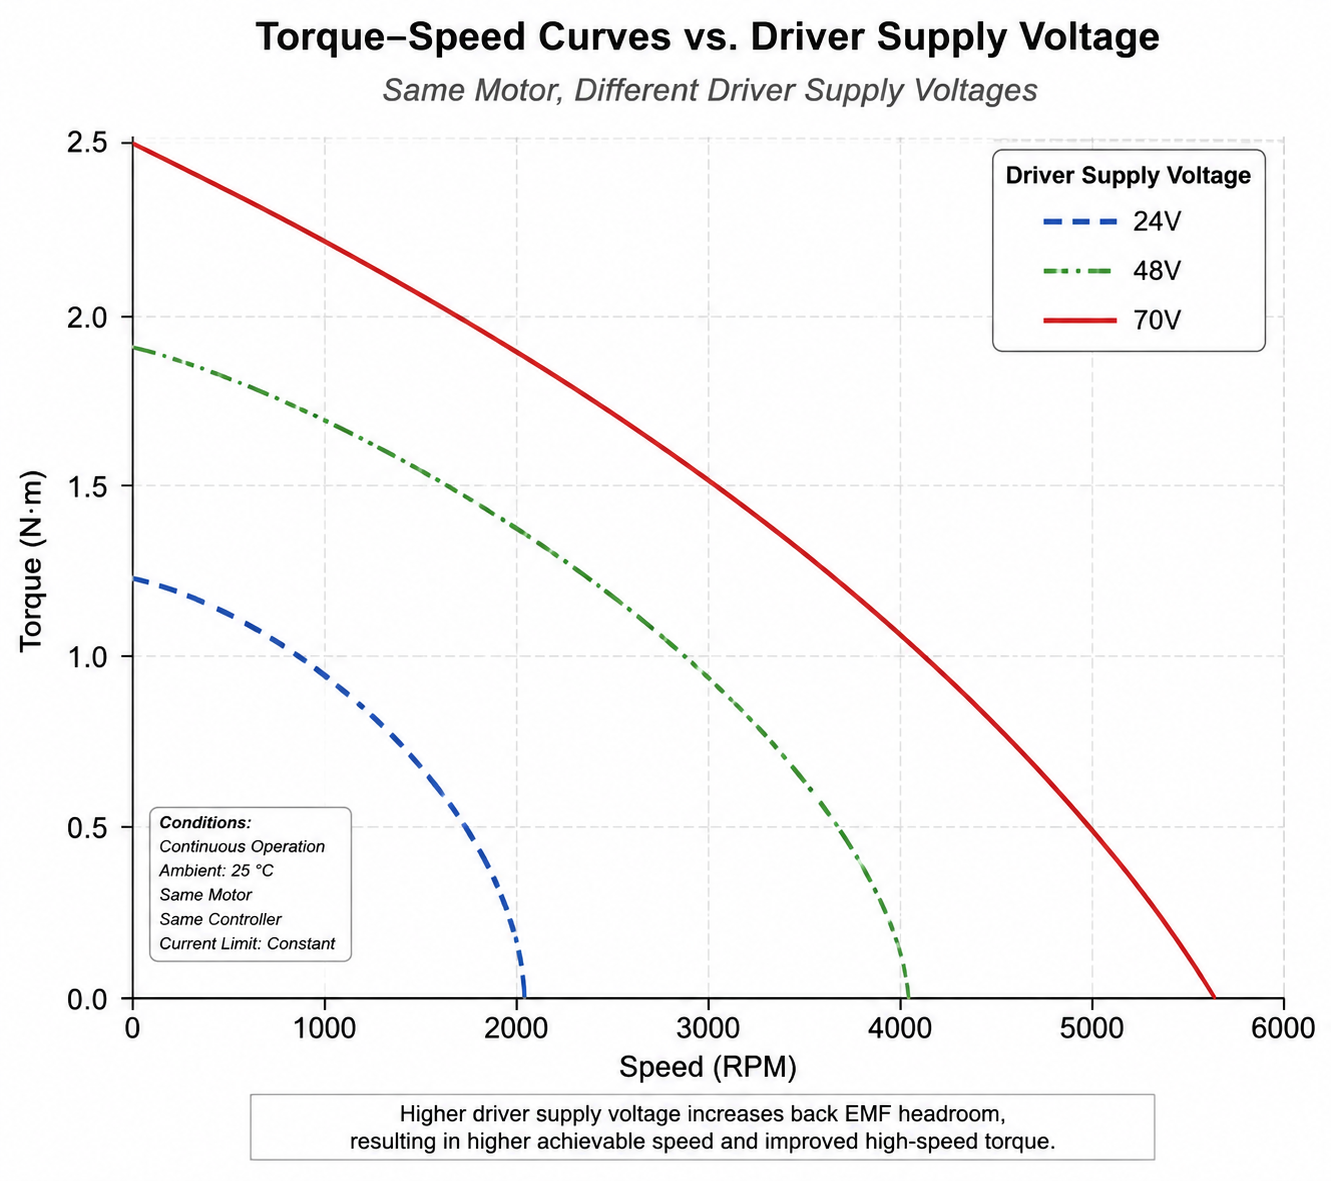
Back EMF makes it worse. A spinning rotor generates voltage that opposes the supply. The faster it spins, the higher the back EMF, and the less net voltage is available to drive current into the winding. At some speed, the back EMF plus resistive voltage drop equal the supply voltage. Current stops flowing altogether. Torque hits zero. This speed is higher with a higher supply voltage, which is why a 24V driver might get 400 RPM from a motor that does 900 RPM comfortably on 48V. The motor didn't change. The available voltage did.
This is also where step angle comes into the picture. Finer step angles mean higher step rates for the same shaft speed. A 0.9° stepper requires twice as many steps per revolution as a 1.8° motor, so at the same RPM the commutation frequency is double. That means less time per step for current to build. Everything else being equal, the finer-resolution motor will lose torque earlier in the speed range. The trade-off is resolution versus speed capability, and it's one you need to make deliberately.
Resonance Isn't Just Noise
Stepper motor resonance is not a cosmetic problem. At certain speeds, the step frequency aligns with the natural frequency of the rotor-inertia and magnetic-spring system. The rotor overshoots, then gets pulled back, then overshoots again. Instead of moving cleanly from step to step, the shaft oscillates. Torque at that operating point can drop by half or more, and the motor may stall even though the load torque is well within the published pull-out curve.
The typical resonance band for NEMA 23 and NEMA 34 frame motors sits somewhere between 100 and 300 RPM, though the exact range depends on rotor inertia, load inertia, and the motor's electromagnetic design. Some datasheets smooth over this region. Don't trust a curve that looks too clean between 2 and 5 revs per second. Real motors have a dip there, and if your application runs at steady state in that zone, you need to address it.
Torque ripple compounds the problem. Even in a perfectly damped motor, instantaneous torque varies with rotor position within a single step. Under load, this variation creates a velocity modulation that can couple into the machine structure. If you've spent time around stepper-driven axes, you've probably heard a machine that purrs at one feed rate and sounds like it's shaking itself apart at another. That's torque ripple exciting a structural resonance, and it's not on any datasheet.
Microstepping reduces the excitation. By dividing each full step into smaller increments, the current transitions between phases are smoother, and the step-to-step torque variation drops. The downside is that torque per microstep decreases with higher microstep resolution. At 16x microstepping, the incremental torque per microstep is about 10% of full-step torque. For most positioning applications this doesn't matter because the cumulative holding torque across several microsteps provides the needed stiffness. But it's worth knowing if you're counting on torque at a very specific shaft angle.
Voltage: The Lever Most Engineers Leave on the Table
If you remember one thing from everything written here, make it this: the supply voltage feeding your driver has more impact on usable torque at speed than any other single variable you control. More than motor frame size. More than rated current. More than microstep settings.
Here's why. Current rise time in a stepper winding is directly proportional to applied voltage. Double the voltage and you cut the time to reach rated current roughly in half. That means the motor can run at higher speed before current starvation sets in. The same NEMA 23 motor that delivers 0.8 N·m at 600 RPM on a 24V supply might deliver 1.7 N·m at the same speed on 48V. That's not a marginal improvement. That's the difference between a machine that works and one that gets returned.
At some point I tested three voltages on the same motor and same load. The results weren't subtle, so I wrote them down. The numbers below are from an actual bench test, not a simulation.
| Speed (RPM) | Torque at 24V (N·m) | Torque at 48V (N·m) | Torque at 70V (N·m) |
|---|---|---|---|
| 100 | 2.1 | 2.1 | 2.1 |
| 300 | 1.6 | 1.9 | 2.0 |
| 600 | 0.8 | 1.7 | 1.9 |
| 900 | 0.3 | 1.1 | 1.5 |
At low speed, voltage barely matters. The winding has plenty of time to reach rated current regardless. But by 600 RPM, the 24V setup had lost over 60% of its low-speed torque while the 48V and 70V setups held strong. This is why comparing torque curves across manufacturers only works if you know the test voltage. A motor tested at 70V will look dramatically better at speed than the same motor tested at 24V. Some suppliers publish curves at voltages far above what most OEMs actually use. Check the fine print.
Higher voltage does increase motor heating and driver switching losses, so there's a thermal limit. But in industrial automation, the practical voltage ceiling is usually set by the driver's maximum input rating and safety regulations, not by motor thermal constraints — provided the average current stays within spec.
Applying Torque Curves to Real Machine Design
The torque curve isn't something you glance at after picking a motor. It's the tool you use to pick the motor in the first place. The process should start with application requirements: load inertia reflected to the motor shaft, required acceleration rate, maximum speed, available supply voltage, and duty cycle. From there you calculate the torque the motor must produce during acceleration, constant speed, and deceleration.
Acceleration torque almost always dominates. A move profile that requires 0.6 N·m to overcome friction at constant speed might need 2.1 N·m to hit the acceleration target. That 2.1 N·m has to sit below the pull-out curve at the speed where acceleration transitions to constant velocity. If it doesn't, the motor will stall at that transition point every time.
Margin matters more for steppers than for servos. An open-loop stepper should have at least 30% margin below the pull-out curve, and 50% is not conservative if the load varies, the machine vibrates, or downtime is expensive. Closed-loop stepper systems can run tighter margins because the driver catches missed steps. But the pull-out curve is still a hard limit. An encoder tells you the motor stalled; it doesn't prevent the stall.
Inertia matching is another factor that torque curves don't explicitly show but that strongly affects real-world performance. Keep total load inertia reflected to the motor shaft below 10 times the motor's rotor inertia for open-loop applications. Go beyond that and resonance gets harder to manage, acceleration becomes unpredictable, and the usable torque curve effectively shrinks because the motor is spending energy fighting its own load dynamics.
Acceleration profile shape matters too. A trapezoidal move with constant acceleration spends time at the transition point where torque demand is highest. An S-curve profile spreads the demand more evenly and can keep peak torque lower. If you're operating near the pull-out limit, an S-curve might be the difference between reliable operation and intermittent stalling.
Mistakes That Keep Showing Up in the Field
After enough time troubleshooting machines, certain patterns become obvious. These aren't edge cases. They're mistakes that show up across companies, industries, and experience levels.
| What Goes Wrong | Why It Happens | How to Avoid It |
|---|---|---|
| Motor stalls at speed despite being "correctly sized" | Motor was sized using holding torque only; torque at running speed is much lower | Size based on pull-out curve at the required operating speed, not the static rating |
| Performance worse than datasheet curve suggests | Driver supply voltage lower than the voltage used for the published curve | Match supply voltage to datasheet conditions, or derate accordingly |
| Motor misses steps during acceleration | Load inertia too high relative to rotor inertia; acceleration torque exceeds pull-out | Keep load-to-rotor inertia ratio under 10:1; verify accel torque against curve |
| Motor vibrates badly at one specific speed | Operating in the resonance band continuously | Use microstepping, add damping, or shift operating speed outside the resonant zone |
| Intermittent stalling with no obvious cause | Torque margin too thin; line voltage variation or temperature drift pushes past limit | Design with 30-50% margin below pull-out curve for open-loop systems |
The one about voltage mismatch deserves extra attention. A designer sees a motor rated for 2.0 N·m at 600 RPM on a 48V torque curve, specifies that motor, then builds the machine with a 24V power supply because it's cheaper or already used elsewhere in the system. The motor produces maybe 0.9 N·m at 600 RPM on 24V. The load needs 1.2 N·m. The motor stalls. The designer blames the motor, or the driver, or the mechanical assembly. The actual problem is a system-level voltage decision made months earlier by someone who didn't understand the torque curve's dependence on supply voltage.
Application Examples: How the Curve Drives the Decision
On a CNC router, the X and Y axes see two very different torque demands. Cutting moves happen at moderate speed with moderate load. Rapid traverses happen at high speed with no cutting load but high acceleration torque. Designers often check torque at cutting speed, see plenty of margin, and call it done. Then the machine stalls during a rapid traverse because torque at 800 RPM is a fraction of what's available at 200 RPM. The fix is either higher voltage, a motor with lower inductance, or a less aggressive rapid speed. All three options come directly from the torque curve analysis.
Pick-and-place systems are all about acceleration. The constant-speed portion of the move is short or nonexistent. The motor accelerates hard, maybe cruises for 50 milliseconds, then decelerates. Torque demand is high across a broad speed range, so a flat pull-out curve is worth more than a high peak at low speed. Motors with low inductance and high-voltage drivers dominate in these applications. Inertia matching gets extra scrutiny because the payload mass changes, which shifts the reflected inertia and changes the torque requirement at the motor shaft.
Medical dosing pumps operate at the other end of the spectrum. Speeds are low, often below 100 RPM, and velocity smoothness matters more than peak torque. Torque ripple affects dosing accuracy, so microstepping is almost universal. Resonance in the low-speed band can cause pulsation in the fluid delivery. These applications don't stress the pull-out curve at all, but they're sensitive to the torque variations that most industrial applications ignore.
Indexing conveyors fall somewhere in the middle. The motor accelerates a belt or chain, runs at constant speed, and stops. The constant-speed load is usually friction-dominated and low. The acceleration load determines whether the motor works or fails. Engineers doing these designs often over-buy on holding torque and under-invest in supply voltage, ending up with a large, expensive motor that still stalls because they starved it of voltage at speed. A smaller motor with a 48V or 70V driver would have delivered better performance at lower cost.
Wrapping Up
Stepper motor torque curves contain the information that actually predicts whether a motor will work in your application. Holding torque is the starting point, not the answer. Pull-in torque tells you what's possible without ramping. Pull-out torque defines your continuous operating envelope. Both drop with speed, and the rate of drop depends more on your driver voltage than on the motor's nameplate rating.
Most field failures I've dealt with boil down to three root causes: voltage too low, load inertia too high, or operation in a resonance zone without mitigation. The torque curve gives you the data to avoid all three, but only if you read it with the right context and apply margin appropriate to your system architecture. Closed-loop steppers let you operate closer to the edge, but the edge itself doesn't move. Torque still falls with speed. Resonance still exists. Inductance still limits current rise.
If you're specifying motors for a new design, get the torque curves at your actual operating voltage. Run the acceleration torque numbers. Apply realistic margin. Test at the extremes of your duty cycle, not just the nominal condition. The hours spent doing this up front are nothing compared to the cost and schedule impact of redesigning a machine that doesn't run reliably on the customer's floor.
Frequently Asked Questions
What's the difference between pull-in torque and pull-out torque?
Pull-in torque is the maximum load a motor can start against from rest and accelerate to a given speed without any acceleration ramp. Pull-out torque is the maximum load it can sustain once already synchronized and running. Because a spinning rotor has momentum that assists the magnetic field, pull-out torque is always higher than pull-in torque at the same speed.
Why does stepper motor torque drop as speed goes up?
Two main reasons. First, winding inductance limits how fast current can rise in each phase. At high step rates, the commutation period is shorter than the winding's electrical time constant, so current never reaches its rated value and torque drops. Second, back EMF from the spinning rotor opposes the applied voltage, reducing the net voltage available to drive current. Higher supply voltage combats both effects.
How do I get more torque at higher speeds?
Increase the driver supply voltage. It's the single most effective change you can make. Higher voltage forces current into the winding inductance faster, extending the usable speed range. Other options include selecting a motor with lower winding inductance or moving to a closed-loop stepper system that can safely operate closer to the pull-out limit.
What causes stepper motor resonance?
Resonance happens when the step frequency matches the natural frequency of the rotor-inertia and magnetic-spring system. The rotor oscillates instead of settling into each step. The typical resonance band for NEMA 23 and 34 motors is 100–300 RPM. Microstepping, anti-resonance driver algorithms, mechanical damping, and programming acceleration to pass through the resonant zone quickly are all viable mitigations.
How much torque margin is enough for an open-loop system?
At least 30% below the pull-out curve for applications with consistent loads and clean mechanical setup. For variable loads, high vibration environments, or applications where a stall means scrapped product or machine damage, 50% is more appropriate. The margin covers torque ripple, supply variation, temperature effects, and the fact that datasheet curves are measured under ideal lab conditions.
Does microstepping cost me torque?
It reduces the torque available at any single microstep position because the phase currents are split. At 16x microstepping, the incremental torque per microstep is roughly 10% of full-step torque. But the motor's overall continuous torque capability isn't significantly reduced. The bigger trade-off is smoother motion and lower resonance versus slightly lower holding stiffness at intermediate positions.
My torque calculations say the motor should work, but it still stalls. Why?
Check the actual bus voltage at the driver during operation, not the power supply's rated voltage. Voltage sag under load is common. Also verify that the driver's current setting matches the motor's rated current, that load inertia wasn't underestimated, and that you're not unknowingly operating in the motor's resonance band. Mechanical issues like binding or misalignment can also increase load torque beyond calculated values.
Does holding torque affect positioning accuracy?
Indirectly. Holding torque determines static stiffness — how much the shaft deflects under an external torque when stationary. More holding torque means less deflection for a given load, which can matter for precision applications. But dynamic positioning accuracy depends on whether the motor misses steps during moves, and that's governed by the pull-out curve, not the holding torque spec.